Apple
How to Inspect an Element on a Mac

You may have included Safari in your list of browsers to test for compatibility with web apps if you are just starting started as a front-end developer or if you need to diagnose faults when testing web applications. An inspection tool known as Inspect Element is required as a result of this.
Inspect Element goes beyond simply inspecting the source code of a webpage, allowing you to see all that is happening behind the scenes of a webpage. It’s easy to view everything in one place: the HTML, style sheets, media, and other aspects. This tutorial will show you how to utilize Inspect Element on a Mac.
Read Also: How to Connect AirPods to MacBook Air
How To Enable Inspect Element for Safari on Mac
Prior to being able to utilize the Inspect Element feature on a Mac, you must first activate it in the Safari browser.
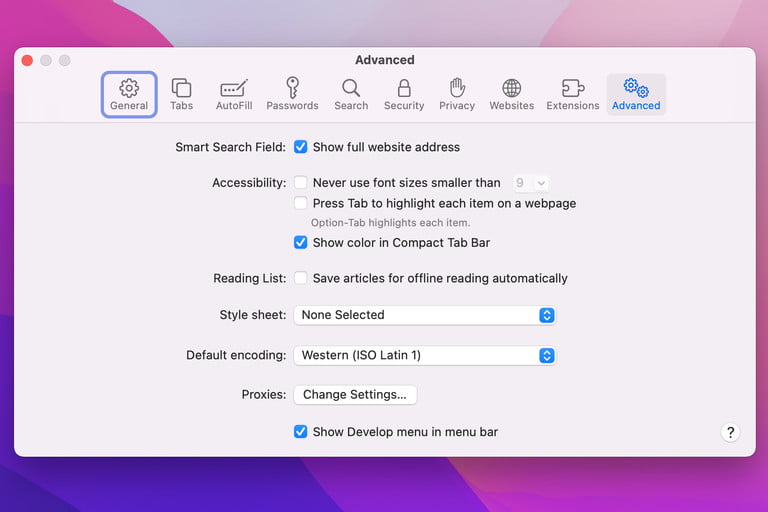
Step1: Preferences may be accessed from the menu bar of Safari by selecting Safari > Preferences.
Step 2: Select the Advanced tab from the drop-down menu.
Step 3: In the menu bar, check the box labelled “Show Develop menu.”
Inspect Element is now available and ready for usage in Safari on Mac, and you can get started right now.

Open Inspect Element in Safari
When the tool is turned on. There are a handful of various ways to get into it. To examine a specific element on the page, you may first choose it from the drop-down menu that appears. Alternatively, you may just launch Inspect Element and choose it from the drop-down menu that appears.
Choose either Develop > Show Web Inspector from the menu bar or right-click the page and select Inspect Element from the shortcut menu to bring up the Web Inspector.
How to Use Inspect Element on Mac
Once you’ve launched Inspect Element, you’ll have access to all of the tools you need to thoroughly examine every element on the webpage. There are also other tools available to you at your disposal. Let’s take a look at the fundamentals of working with Inspect Element first.
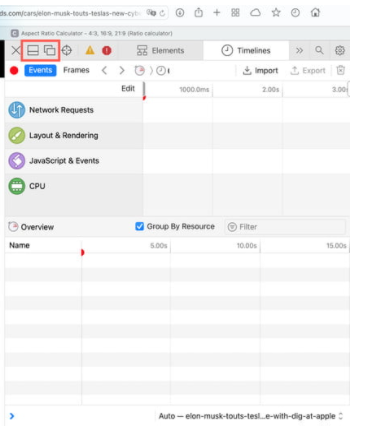
Step 1: Drag and resize the Inspect Element to your liking.
You may dock the tool at the bottom or on the side of the page, or you can pop it out into a different window if you prefer. To move the inspector toolbar, click on one of the icons on the upper left of the inspector toolbar. If you dock the tool, you may use the border to expand or reduce its size by dragging it in either direction.
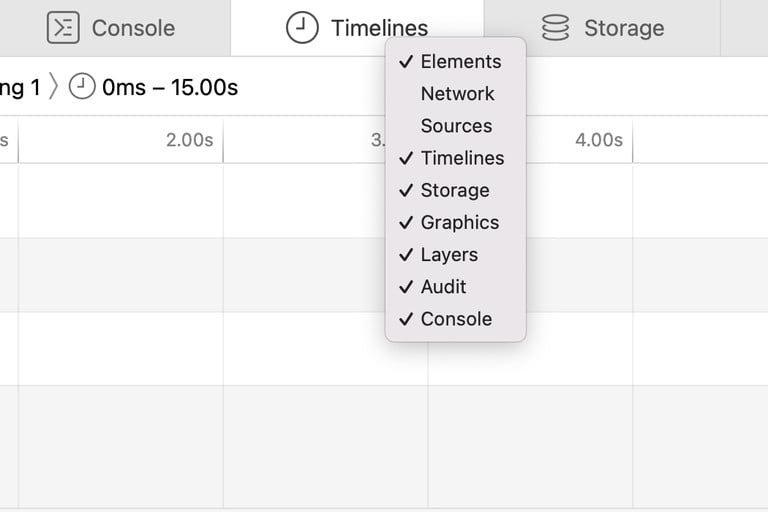
Step 2: Make the tabs more personalized.
To work with, Inspect Element gives nine tabs at the top of the toolbar, which you can go through. Elements, Storage, Layers, and Timelines are some of the features available. You have the option of hiding those that you do not require. Right-click on a tab and then pick the ones you wish to see from the drop-down menu. Checkmarks are placed next to them, and the tabs are added to the toolbar as a result.
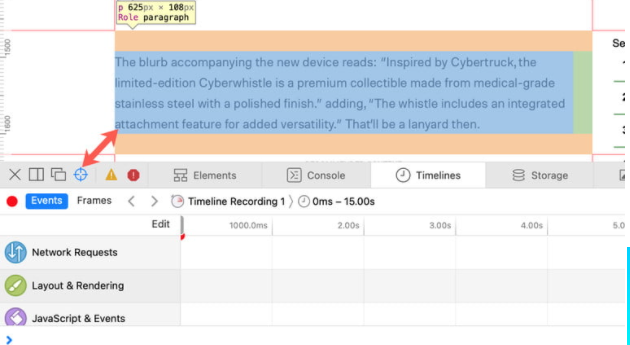
Step 3: Examine a specific element.
The compass icon in the toolbar may be used to choose objects on the page that will be displayed in the tool. Then either drag through the piece on the page or click on it. You may also choose the code or item in the tool that you want to see on the website for that particular element.
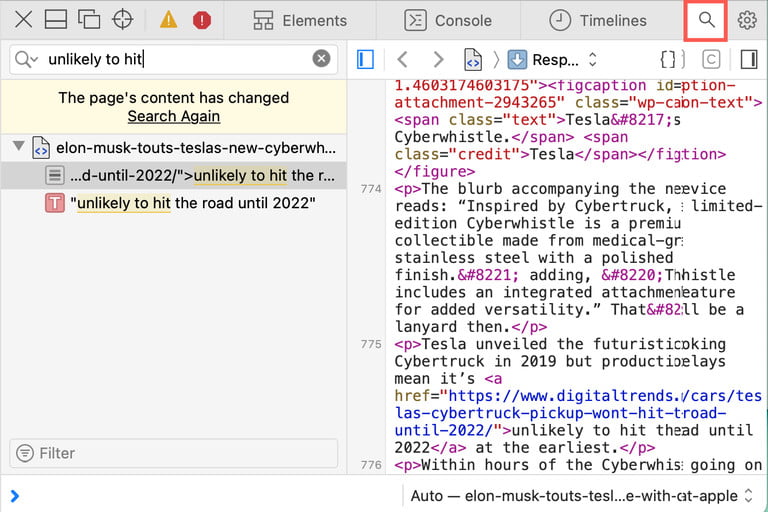
Step 4: Look for a certain element.
If you’re looking for a specific object on the website, such as a text string, you may use the search button to the right of the toolbar to find it quickly. Enter your search word into the box on the left, and your results will appear just below it in the table.
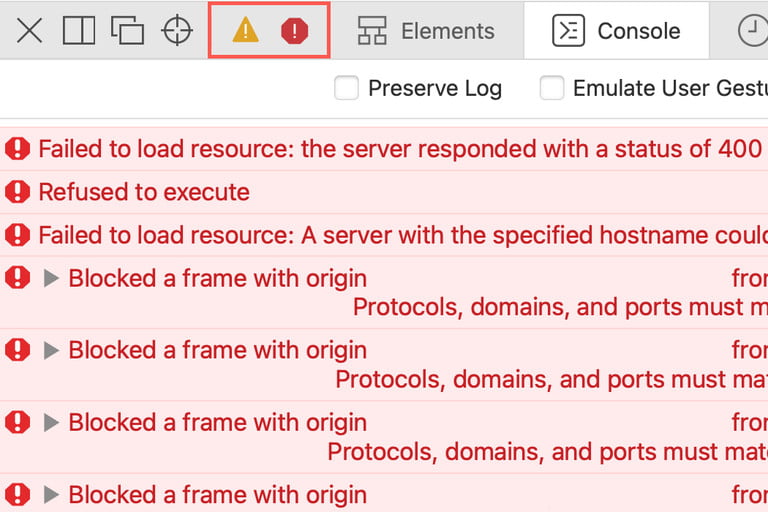
Step 5: Examine any warnings or problems that have occurred.
Warnings and errors will appear in the toolbar if the tool finds them on the page, and you will also see these icons in the toolbar. To display the warnings or errors, select one of the icons on the right.
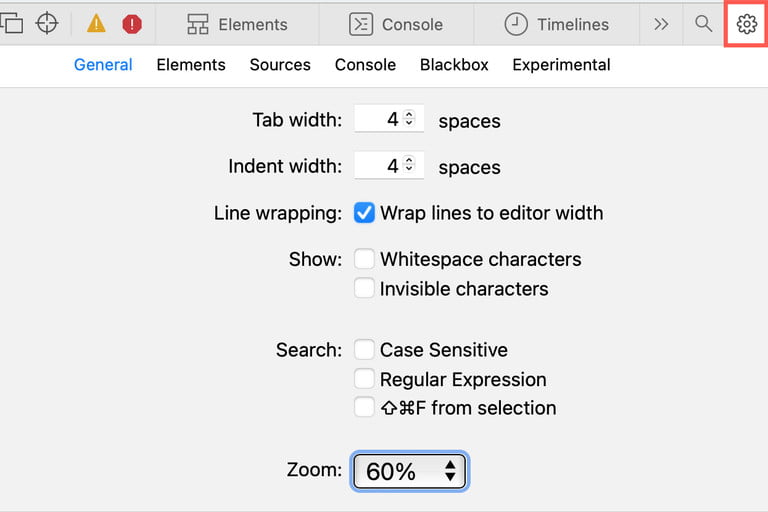
Step 6: Make any necessary adjustments.
You may customise the appearance of Inspect Element by clicking the gear symbol on the far right of the toolbar to enter the Inspect Element settings. You can also activate source maps, zoom, and other features by clicking the gear icon on the far right of the toolbar.
When you’re through with Inspect Element in Safari, click the X in the upper-left corner of the toolbar to shut it completely.
Take your code inspection, application testing, and debugging to the next level with Inspect Element on the Mac, which is designed specifically for Safari.
Video
FAQS
Why can’t I inspect on my Mac?
Simply activate the Show Developer Menu option in Safari’s Preferences, Advanced tab, and you’re done. When you right click on a page, the option Inspect Element will be enabled, allowing you to inspect the element. You may also launch it by pressing Command + Option + I on your keyboard.
What is the shortcut to open inspect element?
You may use the keyboard shortcut Ctrl+Shift+I, or you can right-click on any element on the page and pick Inspect Element from the menu that appears. Right-click the page once more and pick Inspect Element from the context menu, or hit F12 on the keyboard.

Vampire Crawlers Coin Farming Guide

Forza Horizon 6 Performance: Why 60 FPS Is Still the Console Standard

Yoshi and the Mysterious Book (2026) – Full Completion Guide, Rewards & Secret Ending

How to Get Free Pets in Adopt Me: A Guide for Players

Roblox Username Generator – Create a Cool & Unique Username in Seconds
How to Get Free Pets in Adopt Me: A Guide for Players

Grow a Garden Recipes in Roblox: Guide to Cook (Donuts, Sushi, Pie, Pizza & More!)
Roblox Username Generator – Create a Cool & Unique Username in Seconds
Yoshi and the Mysterious Book (2026) – Full Completion Guide, Rewards & Secret Ending