Guide
How to Group in Excel

Excel’s grouping of rows and columns allows you to collapse and expand sections of a worksheet at will. As a result, vast and complex datasets may be comprehended considerably more readily. Views become more compact and arranged as a result of this. This post will walk you through the process of grouping and viewing your data.
Read Also: How to Highlight Duplicates in Microsoft Excel
How to Grouping in Excel
You can either manually select the rows and columns that should be included in the group, or you can instruct Excel to automatically detect groups of data to include. Groups can also be nested within other groups, allowing for the creation of a multi-level hierarchical structure. Once your data has been grouped, you can either individually expand and collapse groups, or you can expand and collapse all groups at a given level in the hierarchy, depending on your needs.
Using groups to navigate and view large and complex spreadsheets is a very convenient way to save time. They make it much easier to concentrate on the information that is most important. Using Groups and Power Pivot For Excel are both recommended if you need to make sense of large amounts of complex data.
How to Use Excel to Group Rows Manually
When generating Excel group rows, the most straightforward method is to first choose the rows that you desire to include in the group, and then merge them into a single group.
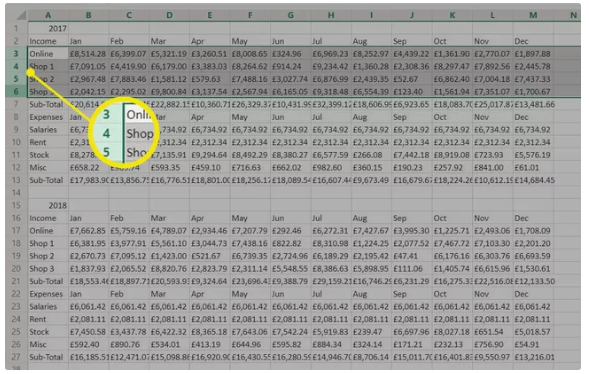
1. Make a selection of the first row number in the group of rows you desire to group and drag it down to the last row number to pick all of the rows in the group.
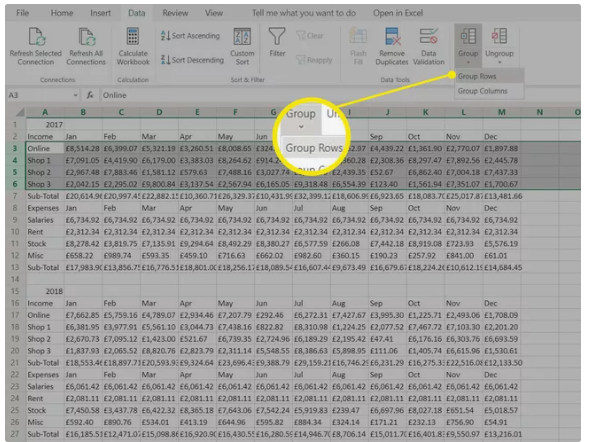
2. It varies depending on which version of Excel you’re using, but either go to the Data tab > Group > Group Rows, or simply select Group from the drop-down bar will suffice.
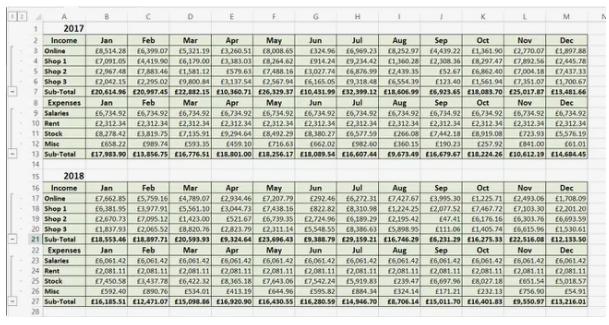
3. The extent to which the grouped rows have been viewed will be indicated by a thin line to the left of the row numbers to the left of the row numbers.
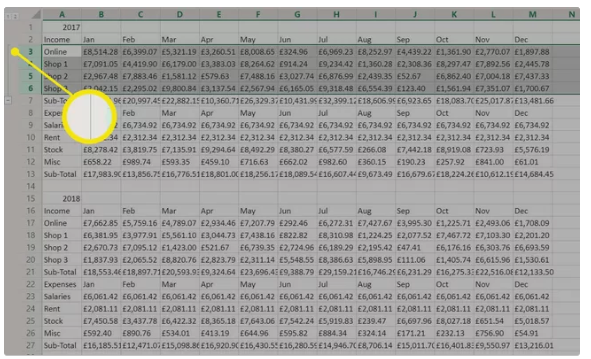
4. Every single row has been brought together, and it is now possible to collapsible and extend them as needed. Due to this, it is much easier to narrow down the information to simply the most necessary information.
How to Make Excel Group Columns and Rows Automatically
You could, of course, repeat the preceding procedures for each group of data in your document, but Excel can detect groups of data automatically and construct them for you instead. When formulas refer to a continuous range of cells in a single row or column, Excel produces groups in that row or column. If your worksheet does not contain any formulas, Excel will not be able to automatically construct groups for you in this situation.
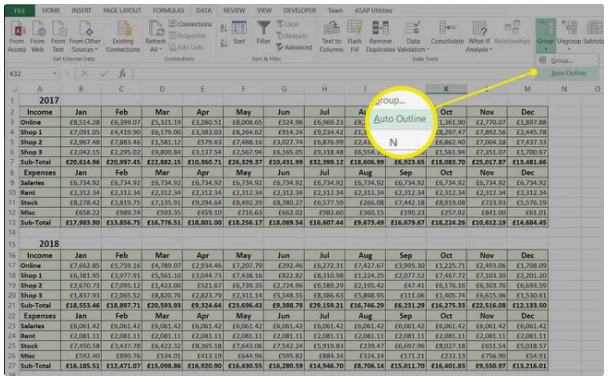
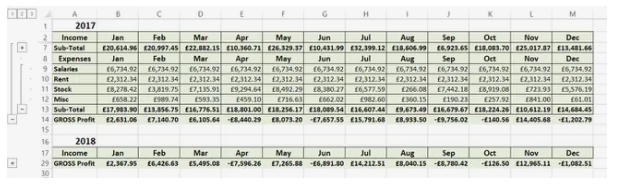
If you select the Data tab > Group > Auto Outline from the ribbon, Excel will automatically form the groups for you. Excel accurately identified each set of rows in this presentation for the purposes of this demonstration. This is because there is no annual total for each type of expenditure, and hence the columns have not been automatically grouped together.
Video

Vampire Crawlers Coin Farming Guide

Forza Horizon 6 Performance: Why 60 FPS Is Still the Console Standard

Yoshi and the Mysterious Book (2026) – Full Completion Guide, Rewards & Secret Ending

How to Get Free Pets in Adopt Me: A Guide for Players

Roblox Username Generator – Create a Cool & Unique Username in Seconds
How to Get Free Pets in Adopt Me: A Guide for Players
Yoshi and the Mysterious Book (2026) – Full Completion Guide, Rewards & Secret Ending
Vampire Crawlers Coin Farming Guide