How to Create a Geographical Map Chart in Google Sheets

Have you accumulated a significant amount of geographical information in Google Sheets? Why not build an eye-catching visual representation of your data with the help of a map chart? In Google Sheets, it is simple to incorporate, personalize, and make changes to a map chart.
Read Also: How to Add Columns on Google Sheets
How to Create a Geographical Map Chart in Google Sheets
Insert a Map Chart in Google Sheets
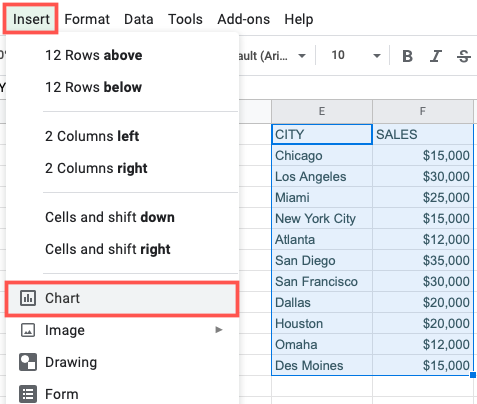
Go to Google Sheets, login in if you haven’t already, and then open your spreadsheet there. Choose the information that you would like to include in the map chart. This is a simple task that may be accomplished by clicking and dragging the pointer through the range of cells.
After that, go to the top menu and select Insert > Chart.
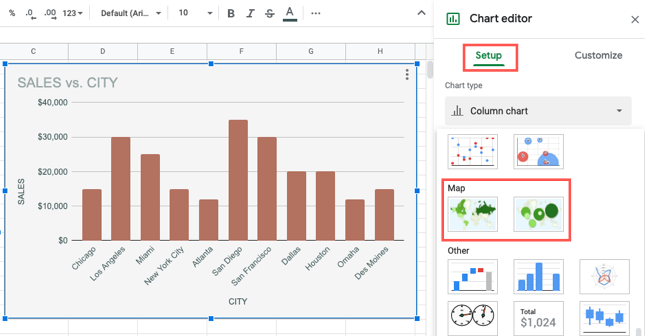
When you open a new sheet in Google Sheets, it will automatically include a default chart type. Therefore, the first thing that needs to be done is to modify the chart type that is displayed in the sidebar of the Chart Editor.
On the Setup page, pick the drop-down box labelled “Chart Type,” then scroll down until you reach the Map section. There is a Geo Chart and a Geo Chart With Markers available for your selection. This tutorial will make use of the second option. This is something that, at a later time, if you so choose, you can change.
You’ll notice that the chart has been updated to reflect the map chart type that you chose. The following step is to personalize the chart.
Customize a Map Chart in Google Sheets
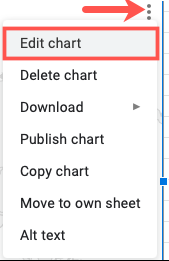
Even if you have already closed the sidebar, it is simple to open it back up again. Choose the chart you want to edit, then click the three dots in the top right corner to access the menu.
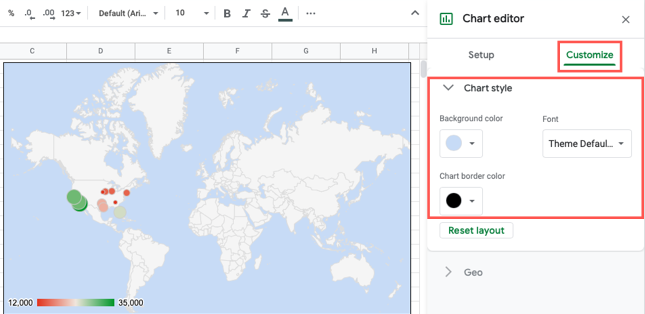
Click the “Customize” tab at the very top of the Chart Editor window when the sidebar is active.
Expand the “Chart Style” area to make adjustments to the chart’s colour scheme and typography. Make your selections for the Background Color, Chart Border Color, and Font by using the drop-down menus located in the respective boxes.
Expand the Geo section to modify the colours associated with the region as well as the region itself. To narrow your attention, select a region from the list in the drop-down menu. You have a choice between eight different regions, some of which include the United States, Africa, Asia, and Europe.
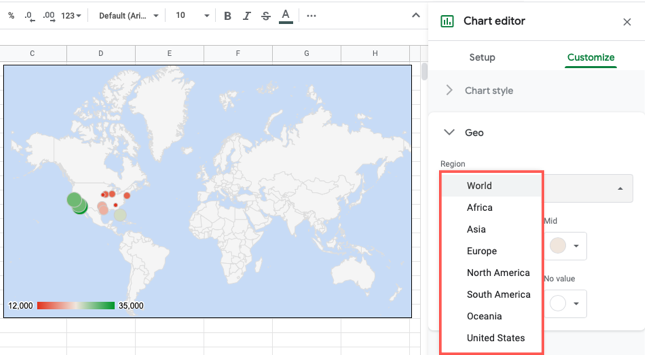
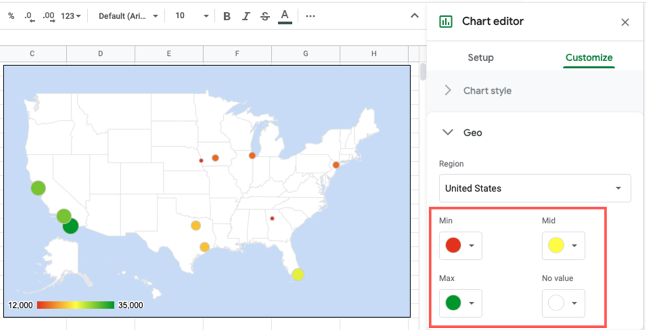
Obviously, the location data contained on your sheet will determine the region you choose to focus on. For the purpose of this example, we will pick the United States because that is where the majority of our data is kept.
Next, you have the option of changing the colours used for the No Value, Min, Mid, and Max objects on the map. Just be sure to pick colours that are not difficult for the people in your audience to make out.
FAQS
How do I create a regional map in Excel?
Now that the time has come to construct a map chart, choose any cell that is contained inside the data range, then navigate to the Insert tab, select Charts, then select Maps, and finally select Filled Map. If the preview appears to be accurate, you should press the OK button. Excel will insert either a value map or a category map, depending on the data that you provide.
How do I make an interactive map for free?
Mapme. Mapme is a straightforward and uncomplicated application that enables users to create interactive maps. You don’t need to be a programmer or a GIS expert to utilise this application; all you have to do is make use of the editor that’s packed with features to make or customise an interactive map.
Can I map multiple locations on Google Maps?
You are unable to map several places using the Google Maps app that is designed for mobile devices; but, you are able to do so by utilising the My Maps function that is available on the Google Maps website. You are unable to map several places using the Google Maps app that is designed for mobile devices; but, you are able to do so by utilising the My Maps function that is available on the Google Maps website.
What is an interactive Google map?
Maps that are interactive and collaborative are a terrific method to identify and share important landmarks, routes to school, or aspects of a local area in the vicinity of a school, office, or in your community. The ‘Google My Map’ tool is one of the simplest tools available, but it is also one of the most powerful tools that can be used to create interactive maps.

Vampire Crawlers Coin Farming Guide

Forza Horizon 6 Performance: Why 60 FPS Is Still the Console Standard

Yoshi and the Mysterious Book (2026) – Full Completion Guide, Rewards & Secret Ending

How to Get Free Pets in Adopt Me: A Guide for Players

Roblox Username Generator – Create a Cool & Unique Username in Seconds
How to Get Free Pets in Adopt Me: A Guide for Players

Grow a Garden Recipes in Roblox: Guide to Cook (Donuts, Sushi, Pie, Pizza & More!)
Roblox Username Generator – Create a Cool & Unique Username in Seconds
Vampire Crawlers Coin Farming Guide