Cryptocurrency
How to Read Cryptocurrency Charts
At this point, cryptocurrency has been at the forefront of most news stories for years. Cryptocurrency has come a long way since its days as a relatively unheard-of and, to many people, incomprehensible method of exchanging currency online; it is now firmly established as both an economic and cultural mainstay. In spite of the fact that it has made its way into the mainstream, many individuals continue to have a poor understanding of what cryptocurrency actually is. This confusion is caused by the technological properties of cryptocurrencies, the nature of cryptocurrencies to be stateless, and the sheer number of different cryptocurrencies. People should be able to make more informed financial decisions once they have a better understanding of the tides that move the value of cryptocurrencies, whether they are potential investors or just have a general curiosity about crypto in general. You will learn how to read cryptocurrency charts by reading this article. So let’s get started:
Read Also: How to Transfer Crypto from Robinhood to Coinbase
How to Read Cryptocurrency Charts
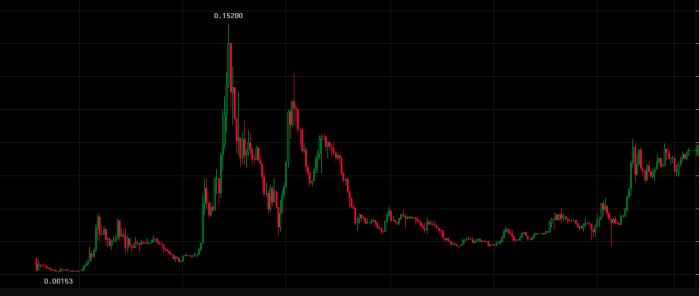
When one is just starting out in the world of investing, a line graph is probably going to be the method of data visualization that they will encounter the most frequently. Viewers are able to quickly determine whether a stock or cryptocurrency has increased or decreased in value thanks to the use of jagged lines that move in an upward and downward motion. These kinds of line graphs are helpful starting points for gaining an understanding of the movements of the market; however, they really only show a portion of the complete picture. Charts of cryptocurrencies, taken as a whole, serve the purpose of data visualizations by illuminating patterns, trends, and opportunities.
However, the most effective method for learning how to read cryptocurrency charts is to first acquire a working knowledge of the monetary jargon and ideas that are associated with the process of investing. To begin, many stock market principles are largely applicable to understanding – and predicting – how cryptocurrencies ultimately perform. This is primarily due to the fact that cryptocurrencies largely operate as investments with their own markets. When Charles Dow created the very first stock market index in 1884, it provided investors with more information about the overall health of the largest companies in the United States as well as the growth possibilities available to those companies.
Primary, Secondary, and Tertiary Trends
With this method, analyzing trends in the stock market and, more recently, in cryptocurrency charts can be done through three distinct channels, all of which are related to the passage of time:
- Primary Trends – Primary trends, which are trends that cover the greatest amount of time, primarily monitor the shifts in the market that occur over the course of months into years. It is important to note that primary trends detail both bull markets, which occur when the values of cryptocurrencies steadily rise, and bear markets, which occur when the same values drop. Bull markets and bear markets follow the same general pattern.
- Secondary Trends – There may be marked blips occurring within the primary trends. In most cases, secondary trends are indicative of a shift in the market that either represents an improvement in the case of a bear market or a decline in the case of a bull market. In the context of the primary trend, these tend to have a relatively short lifespan. However, the window of opportunity for a secondary trend is significant enough to motivate some investors to either buy or sell different cryptocurrency options.
- Tertiary Trends – Tertiary trends are what market analysts call the movements that occur when the market demonstrates anomalies on a single day or potentially over the course of a week. As a rule, these do not cause investors to alter their strategy because of the abrupt and fleeting nature of the changes they bring about.
FAQs
How to predict crypto rise and fall?
Evaluating the intrinsic value of a cryptocurrency allows one to determine whether the price of that cryptocurrency is undervalued or overvalued. Examining qualitative factors like the state of the economy and the conditions of the cryptocurrency market, as well as the management of the cryptocurrency company and its capitalization orization, is one way to achieve this goal.
How do you predict crypto pumps?
The most obvious sign of a pump and dump scheme is when a relatively unknown cryptocurrency experiences a sudden and significant price increase for no discernible reason. This information is readily accessible on the price chart of a coin. As an example, Coincheckup uses a price increase of at least 5% in fewer than five minutes as its benchmark to determine whether or not an indicator has occurred.
Can you predict crypto trends?
It is not possible to make an absolutely accurate forecast of the future of the cryptocurrency market; however, it is reasonable to assume that Bitcoin will make a comeback in 2023.

Vampire Crawlers Coin Farming Guide

Forza Horizon 6 Performance: Why 60 FPS Is Still the Console Standard

Yoshi and the Mysterious Book (2026) – Full Completion Guide, Rewards & Secret Ending

How to Get Free Pets in Adopt Me: A Guide for Players

Roblox Username Generator – Create a Cool & Unique Username in Seconds

Bloxburg Neighborhood Codes 2026
How to Get Free Pets in Adopt Me: A Guide for Players

Grow a Garden Recipes in Roblox: Guide to Cook (Donuts, Sushi, Pie, Pizza & More!)

Job Opportunities in Dubai – 2026